Sectoral Data: Case Study
Flipping the Coin: The two sides of community wealth in England
The Young Foundation (2019)
Report: https://www.youngfoundation.org/publications/flipping-the-coin/
What was the issue?
The inequalities in investment across England and the rest of the UK has come under increasing scrutiny in recent years – especially when considered through the lens of multiple deprivation. Since the EU referendum in 2016, more political and media attention, if not necessarily action, has been given to ‘forgotten’ or ‘left behind’ places than ever before. However, The Young Foundation’s previous work repeatedly showed that these negative characterisations tell only part of the picture – and that in many places local communities demonstrate high levels of strength and resilience.
This project set out to interrogate a range of novel data sets to explore that hypothesis.
What data was used to examine the issue?
Flipping the coin: The two sides of community wealth in England builds on the 2018 Patchwork Philanthropy report, when we looked at patterns of philanthropic and charitable spending across local authorities in England, and compared these to patterns of deprivation, public spending and the UK EU Referendum result. We identified several funding deserts across the country – areas that have particularly high levels of deprivation, whilst receiving low levels of philanthropic funding and public expenditure. It was often these areas that were likely to have voted Leave in the EU referendum.
Flipping the coin analyses other types of wealth generated by communities in England. The Index of Community Strength is a metric we have developed to understand differences in community activity across the country.
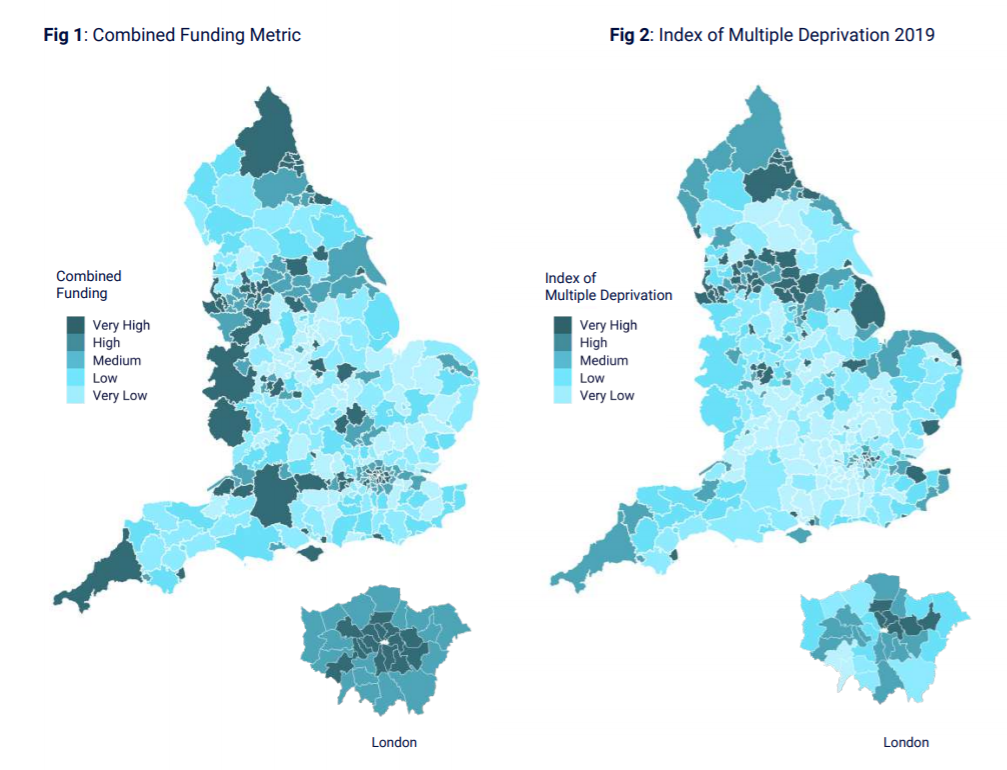
We used data on local government (Core Spend), and charitable (Charity Commission and 360 Giving data) funding to create a Combined Funding Index (Fig 1)
The Combined Funding Index was then overlaid against the 2019 Index of Multiple Deprivation to identify funding deserts at hotspots (Fig 2)
We then gathered a range of innovative data sets that serve as proxy indicators for ‘community strength’. These were obtained through a mix of requests to individual organisations, web searches, and Freedom of Information requests.
How did you use the data to examine the issue?
Using the range of data resources gathered, we developed indicators of community strength across two domains:
Community Ties
These were taken as indicators of the strength of relationships between people in a community. These include initiatives, events and other opportunities that allow people in a community to meet, cultivate relationships and support one another:
Outdoor activities such as Parkrun, Play Streets and Big Lunches
Sharing libraries
Crowdfunded projects
Community transport
Community kitchens and fridges
Independent councillors
Community Resources
These were taken as indicators of community strength in terms of the facilities, assets and resources available to - and managed by - a local community.
Community owned assets
Listed Assets of Community Value
Community Housing
Community Interest Companies
Community Energy
Community Orchards
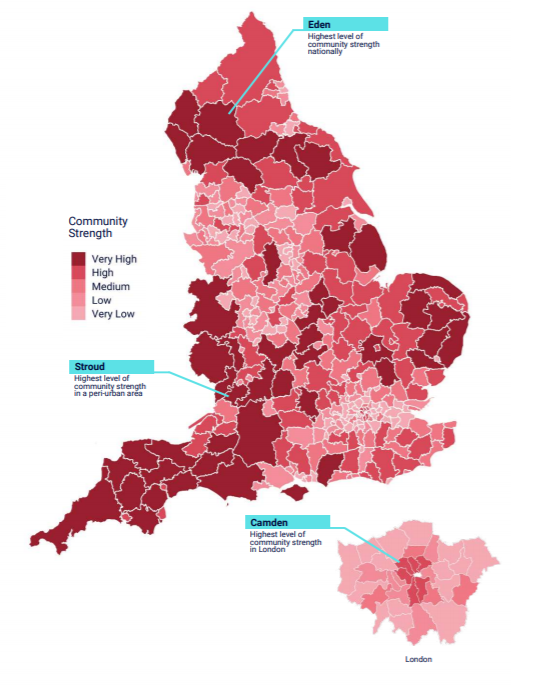
These domains were weighted equally to create an Index of Community Strength (Fig 3).
What were the results of your work?
The key findings show that:
Continuous blocs of urbanised areas suffer from low or very low amounts of funding and affluence in Lancashire, the Midlands and across the East coast of England.
An unbroken stretch of very high funding and affluence exists from Bath in the west to London in the east
Strong communities thrive in some of the most deprived districts in England, yet are notably absent in some of the least deprived.
Amounts of funding and affluence do not predict levels of community strength. Community strength is particularly high in rural parts of the West Country and East Anglia, and much lower in cities and suburban areas across the country.
But some urban districts like Norwich, Camden, Reading and Salford retain strong community ties and resources.
We make no claims to perfection - this Index is very much a ‘beta’ version, although we believe it constitutes one of the most comprehensive and holistic attempts to bring together the community-led activity which is happening across England today.
How did you use the findings?
The findings of our analysis generated significant interest among third sector organisations working to strengthen communities, and within government departments including Ministry of Housing, Communities and Local Government (MHCLG). We are also using the Index to inform decisions about other work undertaken by The Young Foundation.
You can access an interactive 3D visualisation of this data on our website: https://youngfoundation.org/patchwork/3d.html
Conclusion
Our ambition was to refresh and expand the analysis in 2019. However, the Covid-19 pandemic means that this work has been postponed until 2021. We are particularly interested in how we can capture additional metrics which relate to some of the key issues and areas of community activity at this time:
Covid-19 response, such as mutual aid and other activity
The Climate Crisis, with community-led action on the environment
Black Lives Matter, and community-led responses to structural racism and systemic inequalities
We’d also like to expand the analysis out to Scotland, Wales and Northern Ireland.
There are two other main data challenges we are hoping to tackle, and collaborate with others to address:
Charity Commission data requires a huge amount of manual cleaning and analysis of open text. We are exploring ways to at least partially automate this process and are keen to connect with others interested in making this data more usable for this type of analysis
360 Giving data – one of the major limitations is that to avoid skewing the national picture, we have to remove some substantial funders, particularly Community Foundations; not all currently report their data via 360 Giving. Encouraging more funders to sign up and share their data in this standardised way is an important activity to support future analysis.
Please do get in touch via Research@youngfoundation.org if you would like to support or collaborate on our 2021 study, with ideas, sharing data or funding!